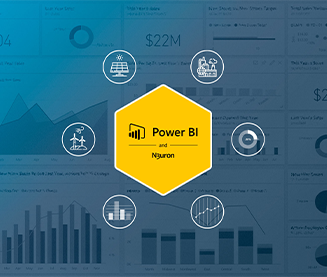
- Introduction to Power BI Desktop and Power BI Website
- Data warehouse tools
- Overview of Data Analysis
- Power BI's primary tools are Power Pivot, Power Query, Power View, and Power Map
- Concept of Data Modeling
- Building Blocks and Architecture of Power BI.
Courses Description
Microsoft Power BI tool for business intelligence and data visualization covers various skills like data preparation, modeling, visualization, and report generation. The components of Power BI include Get Data, DAX, Power BI service (website), how to manage and deploy reports, and a dashboard with collaboration with other team members.
| Date | Days | Timings |
|---|---|---|
| 17-Jun-2024 | Monday (Monday-Friday) |
08:00 AM (IST) |
| 12-May-2024 | Wednesday (Monday-Friday) |
08:00 AM (IST) |
| 15-Jun-2024 | Saturday (Saturday-Sunday) |
11:00 AM (IST) |
| 15-Jun-2024 | Saturday (Saturday-Sunday) |
11:00 AM (IST) |
Course content
-
Introduction to Power BI
-
Power BI Desktop
-
Data Modeling and DAX
-
Data Visualization
-
Power BI Service
- Learn how to deploy Power BI files into the Power BI website.
- Creating mobile-based reports and dashboards.
- Attributes of the Power BI mobile apps
- Workspace and sharing in Power BI website.
- Using Power Q & A
- Using natural query language to ask questions about the data.
- RLS(Row Level Security)
- Export and Embed Options
- Object Level Security (OLS).
- Configuration of Data and Data Gateway.
- Types of Gateway: On-premise and personal.
-
Other Skills
Why Choose Tops Technologies ?
Practical Learning
Experienced Trainers
100% Career oriented
Certification
Why you should learn power bi Course?
- Implementing Power BI can lead to substantial cost savings. Studies by Forrester Consulting indicate that businesses using Power BI benefit from a 271% return on investment over three years, primarily through reduced reporting costs and improved operational efficiency.
- Professionals skilled in Power BI can earn higher salaries. For instance, Power BI developers earn an average salary of $93,000 per year in the US (PayScale).
- Power BI supports connectivity to over 100 data sources, including databases, web services, and online platforms like Google Analytics and Salesforce (Microsoft).
- Power BI has over 6 million active users globally, making it one of the most widely adopted business intelligence tools (Microsoft).
- It is user-friendly, with an intuitive interface that allows users to create complex reports and dashboards without extensive programming knowledge.
- Compared to traditional BI solutions, Power BI offers a cost-effective option with flexible pricing plans suitable for businesses of all sizes (Microsoft).
- There is a plethora of online courses, certifications, and resources available for learning Power BI, catering to different skill levels and learning preferences.
Highlights of Our Power BI Course
- Our strong network of corporate partners ensures that you stay connected with the latest industry trends and job openings.
- Gain proficiency in over 10 essential programming languages and frameworks.
- Complete 20+ real-world projects to build practical skills.
- Access exclusive job opportunities through partnerships with over 100 top IT companies.
- Join a global network with alumni working in more than 15 countries.
- Participate in over 30 interactive workshops and training sessions.
- Receive top-notch interview preparation with mock interviews and feedback.
₹30,000 ₹50,000 40% off
About course:
Power BI course provides comprehensive training to empower you with advanced data analytics skills. You will start with the fundamentals, learning to navigate Power BI Desktop and understand data transformation and modeling techniques. Dive into creating interactive visualizations and reports that drive insights from complex datasets.
Level
Beginner
Topic
Power BI
Class
Online
Duration
3 Months
Language
English
Other includes:
- Full lifetime access
- Downloadable resources
- Certificate of completion


