- Concept and Techniques of Data Analytics.
- Types of data and data formats.
- Types of tools.
- Types of Analytics.
- Advantage of Data Analytics.
- Static Analysis.
- Data understanding and Data preparation.
Courses Description
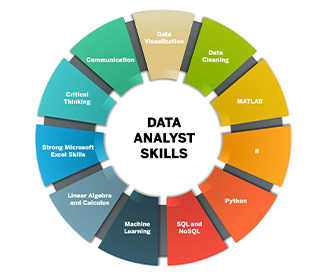
The course dives into the core fundamentals of Data Analytics, Data mining, Machine learning, statistics of data analysis, Business intelligence, and together with some relevant technology. It equips knowledge of theoretical, technical, and practical skills to become a Data Analyst. Timely exposure to, and practical experience in currently used software tools and environments. Enhance skills in algorithms and quantitative for analyzing and mining data and developing decision models in a broad range of application areas. Knowledge of industry-standard software like R, Python, Simul8, Tableau, and Oracle.
| Date | Days | Timings |
|---|---|---|
| 17-Jun-2024 | Monday (Monday-Friday) |
08:00 AM (IST) |
| 12-May-2024 | Wednesday (Monday-Friday) |
08:00 AM (IST) |
| 15-Jun-2024 | Saturday (Saturday-Sunday) |
11:00 AM (IST) |
| 15-Jun-2024 | Saturday (Saturday-Sunday) |
11:00 AM (IST) |
Course content
-
Data Analytics Fundamental
-
Probability and Statistics for Data Analytics
-
Machine Learning
-
Data Visualization
-
Data Visualization Tools
-
Python in Data Analytics
-
SQL
-
Data Mining
-
Big Data
Why Choose Tops Technologies ?
Practical Learning
Experienced Trainers
100% Career oriented
Certification
Why you should learn data analyst Course?
- Data analysts are in high demand, with job postings increasing by 56% in recent years.
- Companies that utilize data analytics effectively are 23 times more likely to acquire customers and 6 times as likely to retain them.
- Data-driven organizations are 19 times more likely to be profitable, according to a McKinsey study.
- Data analysts help businesses reduce costs; for every dollar invested in analytics, companies see a return of $13.01 on average.
- The healthcare sector alone could save up to $300 billion annually through better use of data analytics.
- Data analysis skills are versatile, with 53% of data analyst job postings requiring proficiency in SQL and 43% in Python or R.
- The global shortage of data professionals is estimated to reach 1.5 million job openings by 2025.
Highlights of Our Power BI Course
- Data analysts earn an average salary of $67,000 annually in the United States.
- The demand for data analysts is projected to grow by 31% over the next decade.
- Over 2.5 quintillion bytes of data are generated globally every day.
- Data analysts spend about 80% of their time cleaning and preparing data.
- Companies that use data-driven decision-making are 6% more profitable than those that don't.
- Data analysts typically use an average of 5 different tools or technologies to perform their jobs.
- 87% of organizations consider data analytics a strategic priority.
- 53% of companies have adopted big data analytics, up from 17% in 2015.
About course:
Other includes:
- Full lifetime access
- Downloadable resources
- Certificate of completion


